The easiest way to convert your CSV logs into shareable interactive charts.
Create Free Account
+ logs uploaded! It doesn't get any easier ☝️
-

Interact + Share
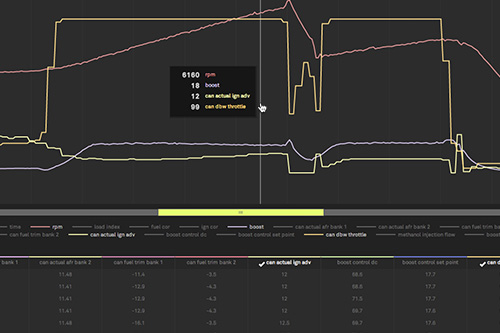
In seconds generate an interactive chart that you can share: zoom, filter data, shared or individual axes, set markers, export an image.
-

Like It Raw?
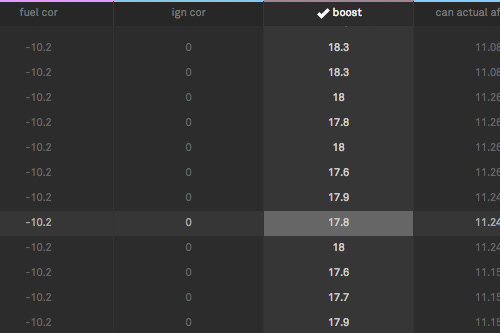
Don't waste time in Excel searching for a specific moment. The raw view automatically follows your position on the interactive chart.
-

Stay Organized
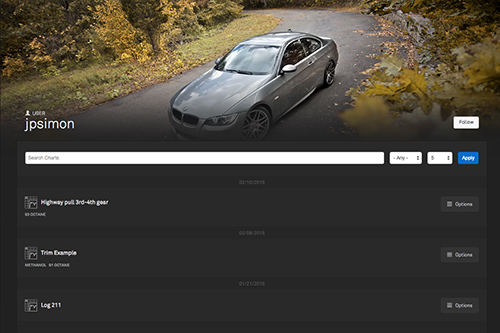
On your profile page search through all your uploaded logs by name, description, or fuel type. Quickly access favorited friends and logs.

